DEMO: reveal(.js)
Demo Template for Jupyter Reveal.js
Hello, There
This presentation will show you examples of what you can do with Quarto and Reveal.js, including:
- Presenting code and LaTeX equations
- Including computations in slide output
- Image, video, and iframe backgrounds
- Fancy transitions and animations
- Printing to PDF
…and much more
Pretty Code
- Over 20 syntax highlighting themes available
- Default theme optimized for accessibility
# Define a server for the Shiny app
function(input, output) {

  # Fill in the spot we created for a plot
  output$phonePlot <- renderPlot({
    # Render a barplot
  })
}
Learn more: Syntax Highlighting
Code Animations
- Over 20 syntax highlighting themes available
- Default theme optimized for accessibility
# Define a server for the Shiny app
function(input, output) {

  # Fill in the spot we created for a plot
  output$phonePlot <- renderPlot({
    # Render a barplot
    barplot(WorldPhones[,input$region]*1000,
            main=input$region,
            ylab="Number of Telephones",
            xlab="Year")
  })
}
Learn more: Code Animations
Line Highlighting
- Highlight specific lines for emphasis
- Incrementally highlight additional lines
import numpy as np
import matplotlib.pyplot as plt

r = np.arange(0, 2, 0.01)
theta = 2 * np.pi * r
fig, ax = plt.subplots(subplot_kw={'projection': 'polar'})
ax.plot(theta, r)
ax.set_rticks([0.5, 1, 1.5, 2])
ax.grid(True)
plt.show()
Learn more: Line Highlighting
Executable Code
#| echo: true
#| fig-width: 10
#| fig-height: 4.5
library(ggplot2)
ggplot(mtcars, aes(hp, mpg, color = am)) +
  geom_point() +
  geom_smooth(formula = y ~ x, method = "loess")
Learn more: Executable Code
LaTeX Equations
MathJax rendering of equations to HTML
Learn more: LaTeX Equations
Inline LaTeX Rendering
MathJax rendering of equations to HTML
Learn more: LaTeX Equations
Column Layout
Arrange content into columns of varying widths:
Motor Trend Car Road Tests
The data was extracted from the 1974 Motor Trend US magazine, and comprises fuel consumption and 10 aspects of automobile design and performance for 32 automobiles.
Learn more: Multiple Columns
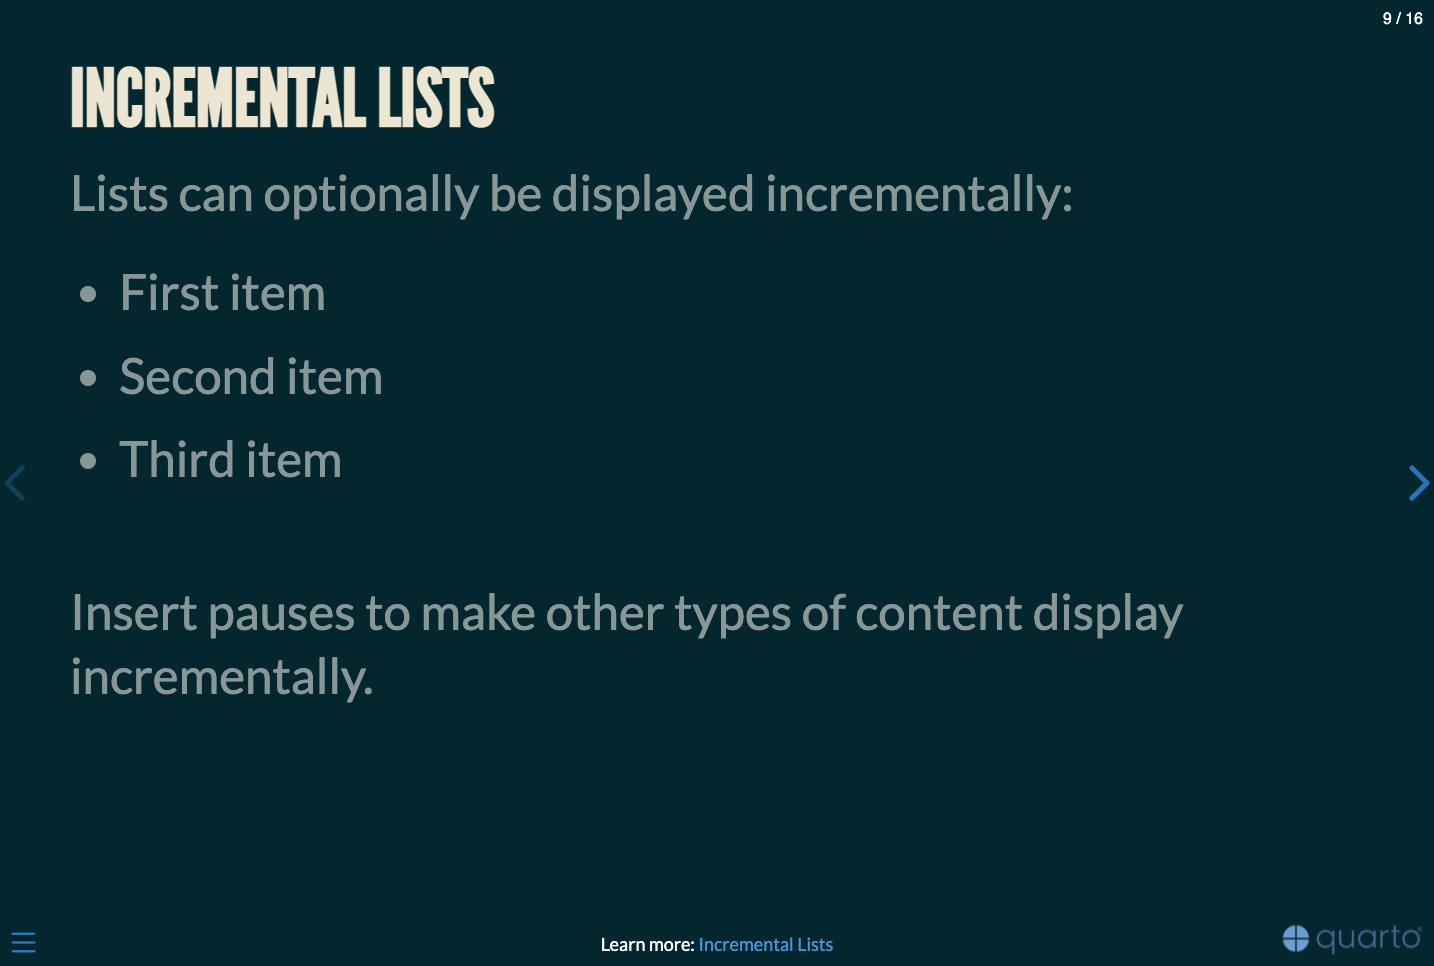
Incremental Lists
Lists can optionally be displayed incrementally:
- First item
- Second item
- Third item
Insert pauses to make other types of content display incrementally.
Learn more: Incremental Lists
Fragments
Incremental text display and animation with fragments:
Fade in
Slide up while fading in
Slide left while fading in
Fade in then semi out
Slide Backgrounds
Set the background attribute on a slide to change the background color (all CSS color formats are supported).
Different background transitions are available via the background-transition option.
Learn more: Slide Backgrounds
Media Backgrounds
You can also use the following as a slide background:
An image:
background-imageA video:
background-videoAn iframe:
background-iframe
Learn more: Media Backgrounds
Absolute Position
Position images or other elements at precise locations


Learn more: Absolute Position
Auto-Animate
Automatically animate matching elements across slides with Auto-Animate.
Learn more: Auto-Animate
Auto-Animate
Automatically animate matching elements across slides with Auto-Animate.
Learn more: Auto-Animate
Slide Transitions
The next few slides will transition using the slide transition
| Transition | Description |
|---|---|
none |
No transition (default, switch instantly) |
fade |
Cross fade |
slide |
Slide horizontally |
convex |
Slide at a convex angle |
concave |
Slide at a concave angle |
zoom |
Scale the incoming slide so it grows in from the center of the screen. |
Learn more: Slide Transitions
Tabsets
Learn more: Tabsets
Interactive Slides
Include Jupyter widgets and htmlwidgets in your presentations
#| echo: false
#| fig-height: 5
library(leaflet)
leaflet() %>%
  addTiles() %>%  # Add default OpenStreetMap map tiles
  addMarkers(lng=174.768, lat=-36.852, popup="The birthplace of R")
Learn more: Jupyter widgets, htmlwidgets
Interactive Slides
Turn presentations into applications with Observable and Shiny. Use component layout to position inputs and outputs.
Learn more: Observable, Shiny, Component Layout
Preview Links
Navigate to hyperlinks without disrupting the flow of your presentation.
Use the preview-links option to open links in an iframe on top of your slides. Try clicking the link below for a demonstration:
Learn more: Preview Links
Themes
10 Built-in Themes (or create your own)


Learn more: Themes
Easy Navigation
Quickly jump to other parts of your presentation
![]()
Toggle the slide menu with the menu button (bottom left of slide) to go to other slides and access presentation tools.
You can also press m to toggle the menu open and closed.
Learn more: Navigation
Chalkboard
Free form drawing and slide annotations
![]()
Use the chalkboard button at the bottom left of the slide to toggle the chalkboard.
![]()
Use the notes canvas button at the bottom left of the slide to toggle drawing on top of the current slide.
You can also press b to toggle the chalkboard or c to toggle the notes canvas.
Learn more: Chalkboard
Point of View
Press o to toggle overview mode:

Hold down the Alt key (or Ctrl in Linux) and click on any element to zoom towards it—try it now on this slide.
Learn more: Overview Mode, Slide Zoom
Speaker View
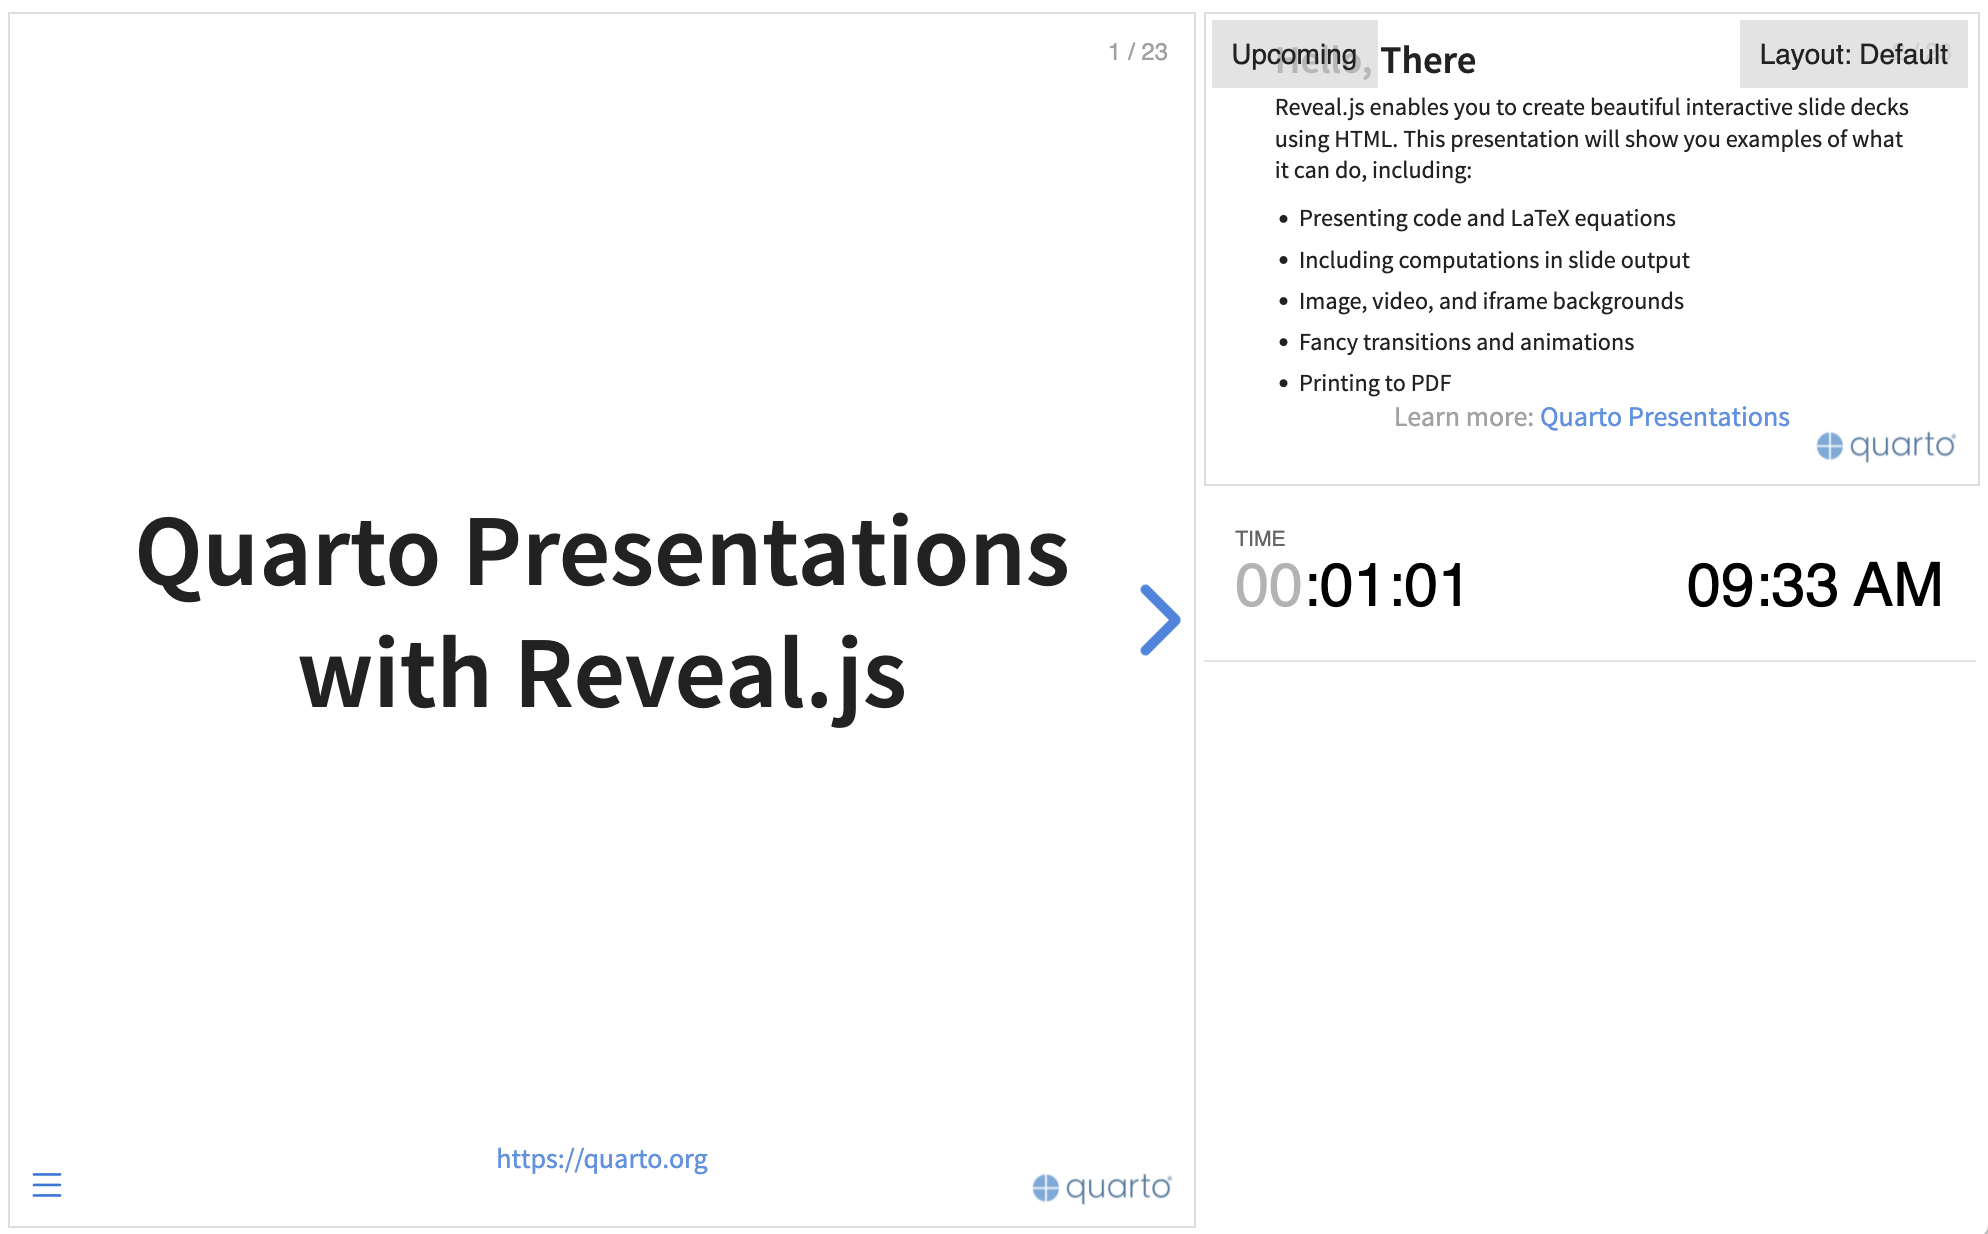
Press s (or use the presentation menu) to open speaker view

Learn more: Speaker View
Authoring Tools
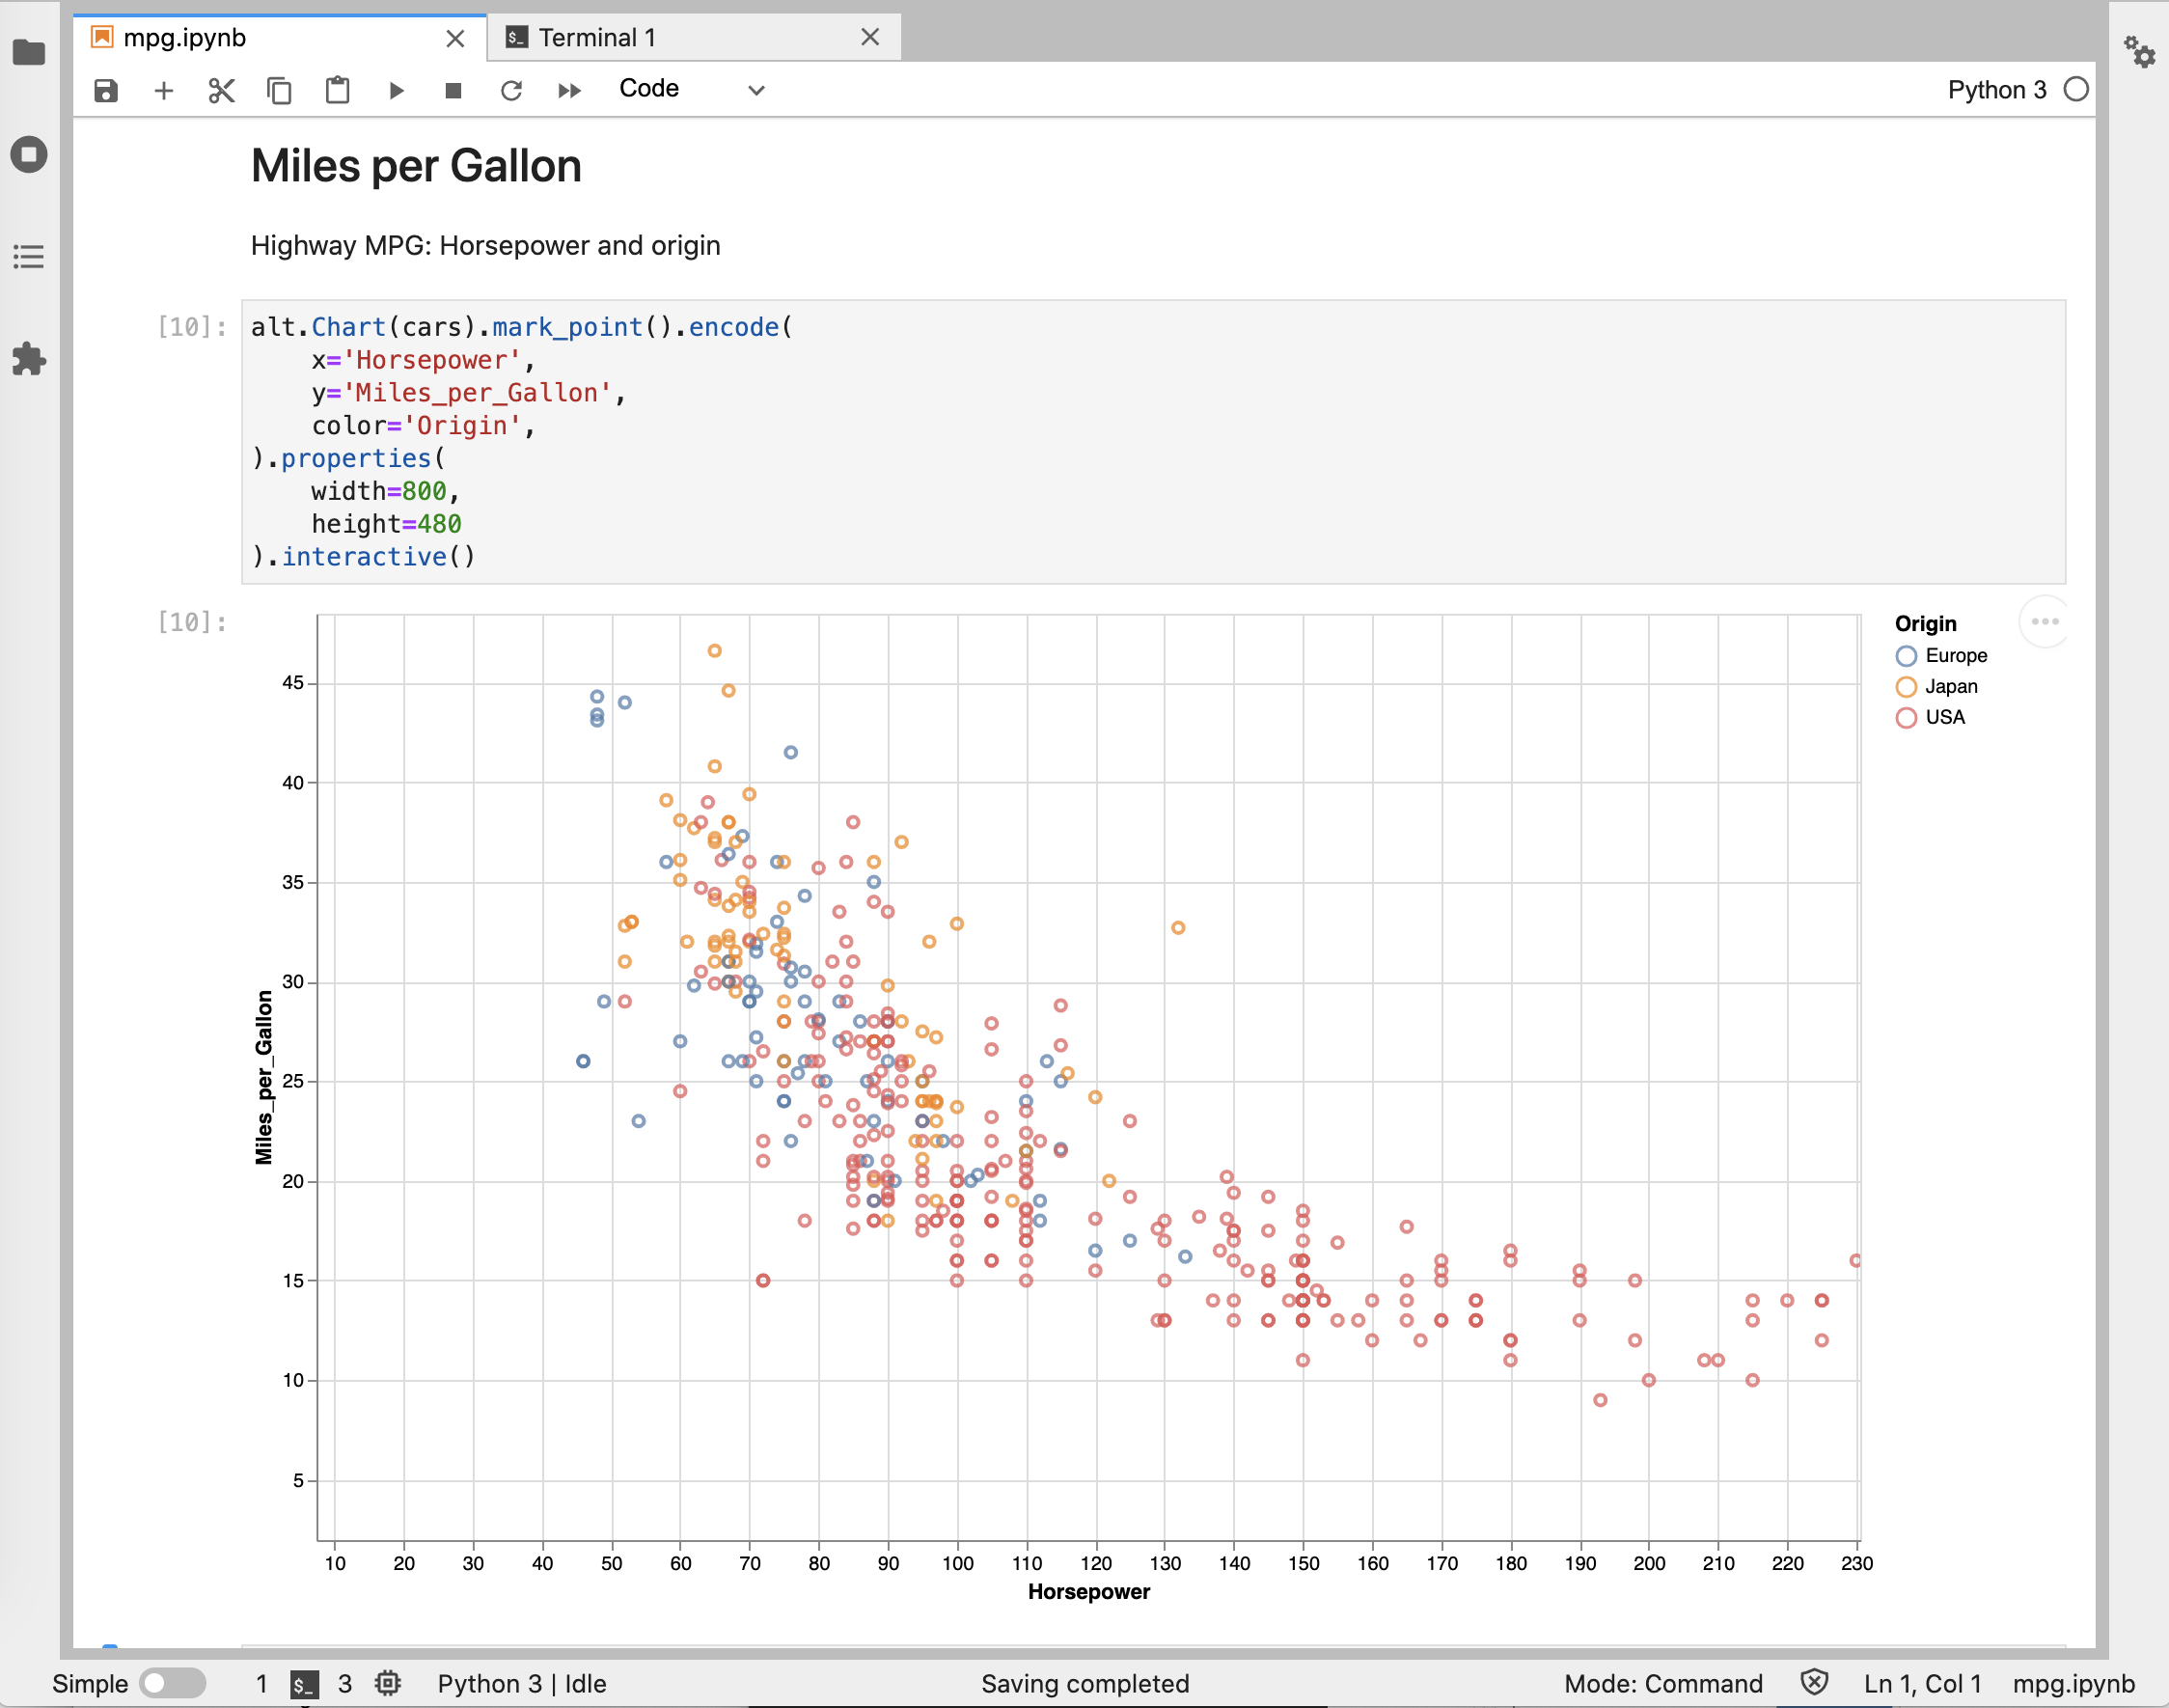
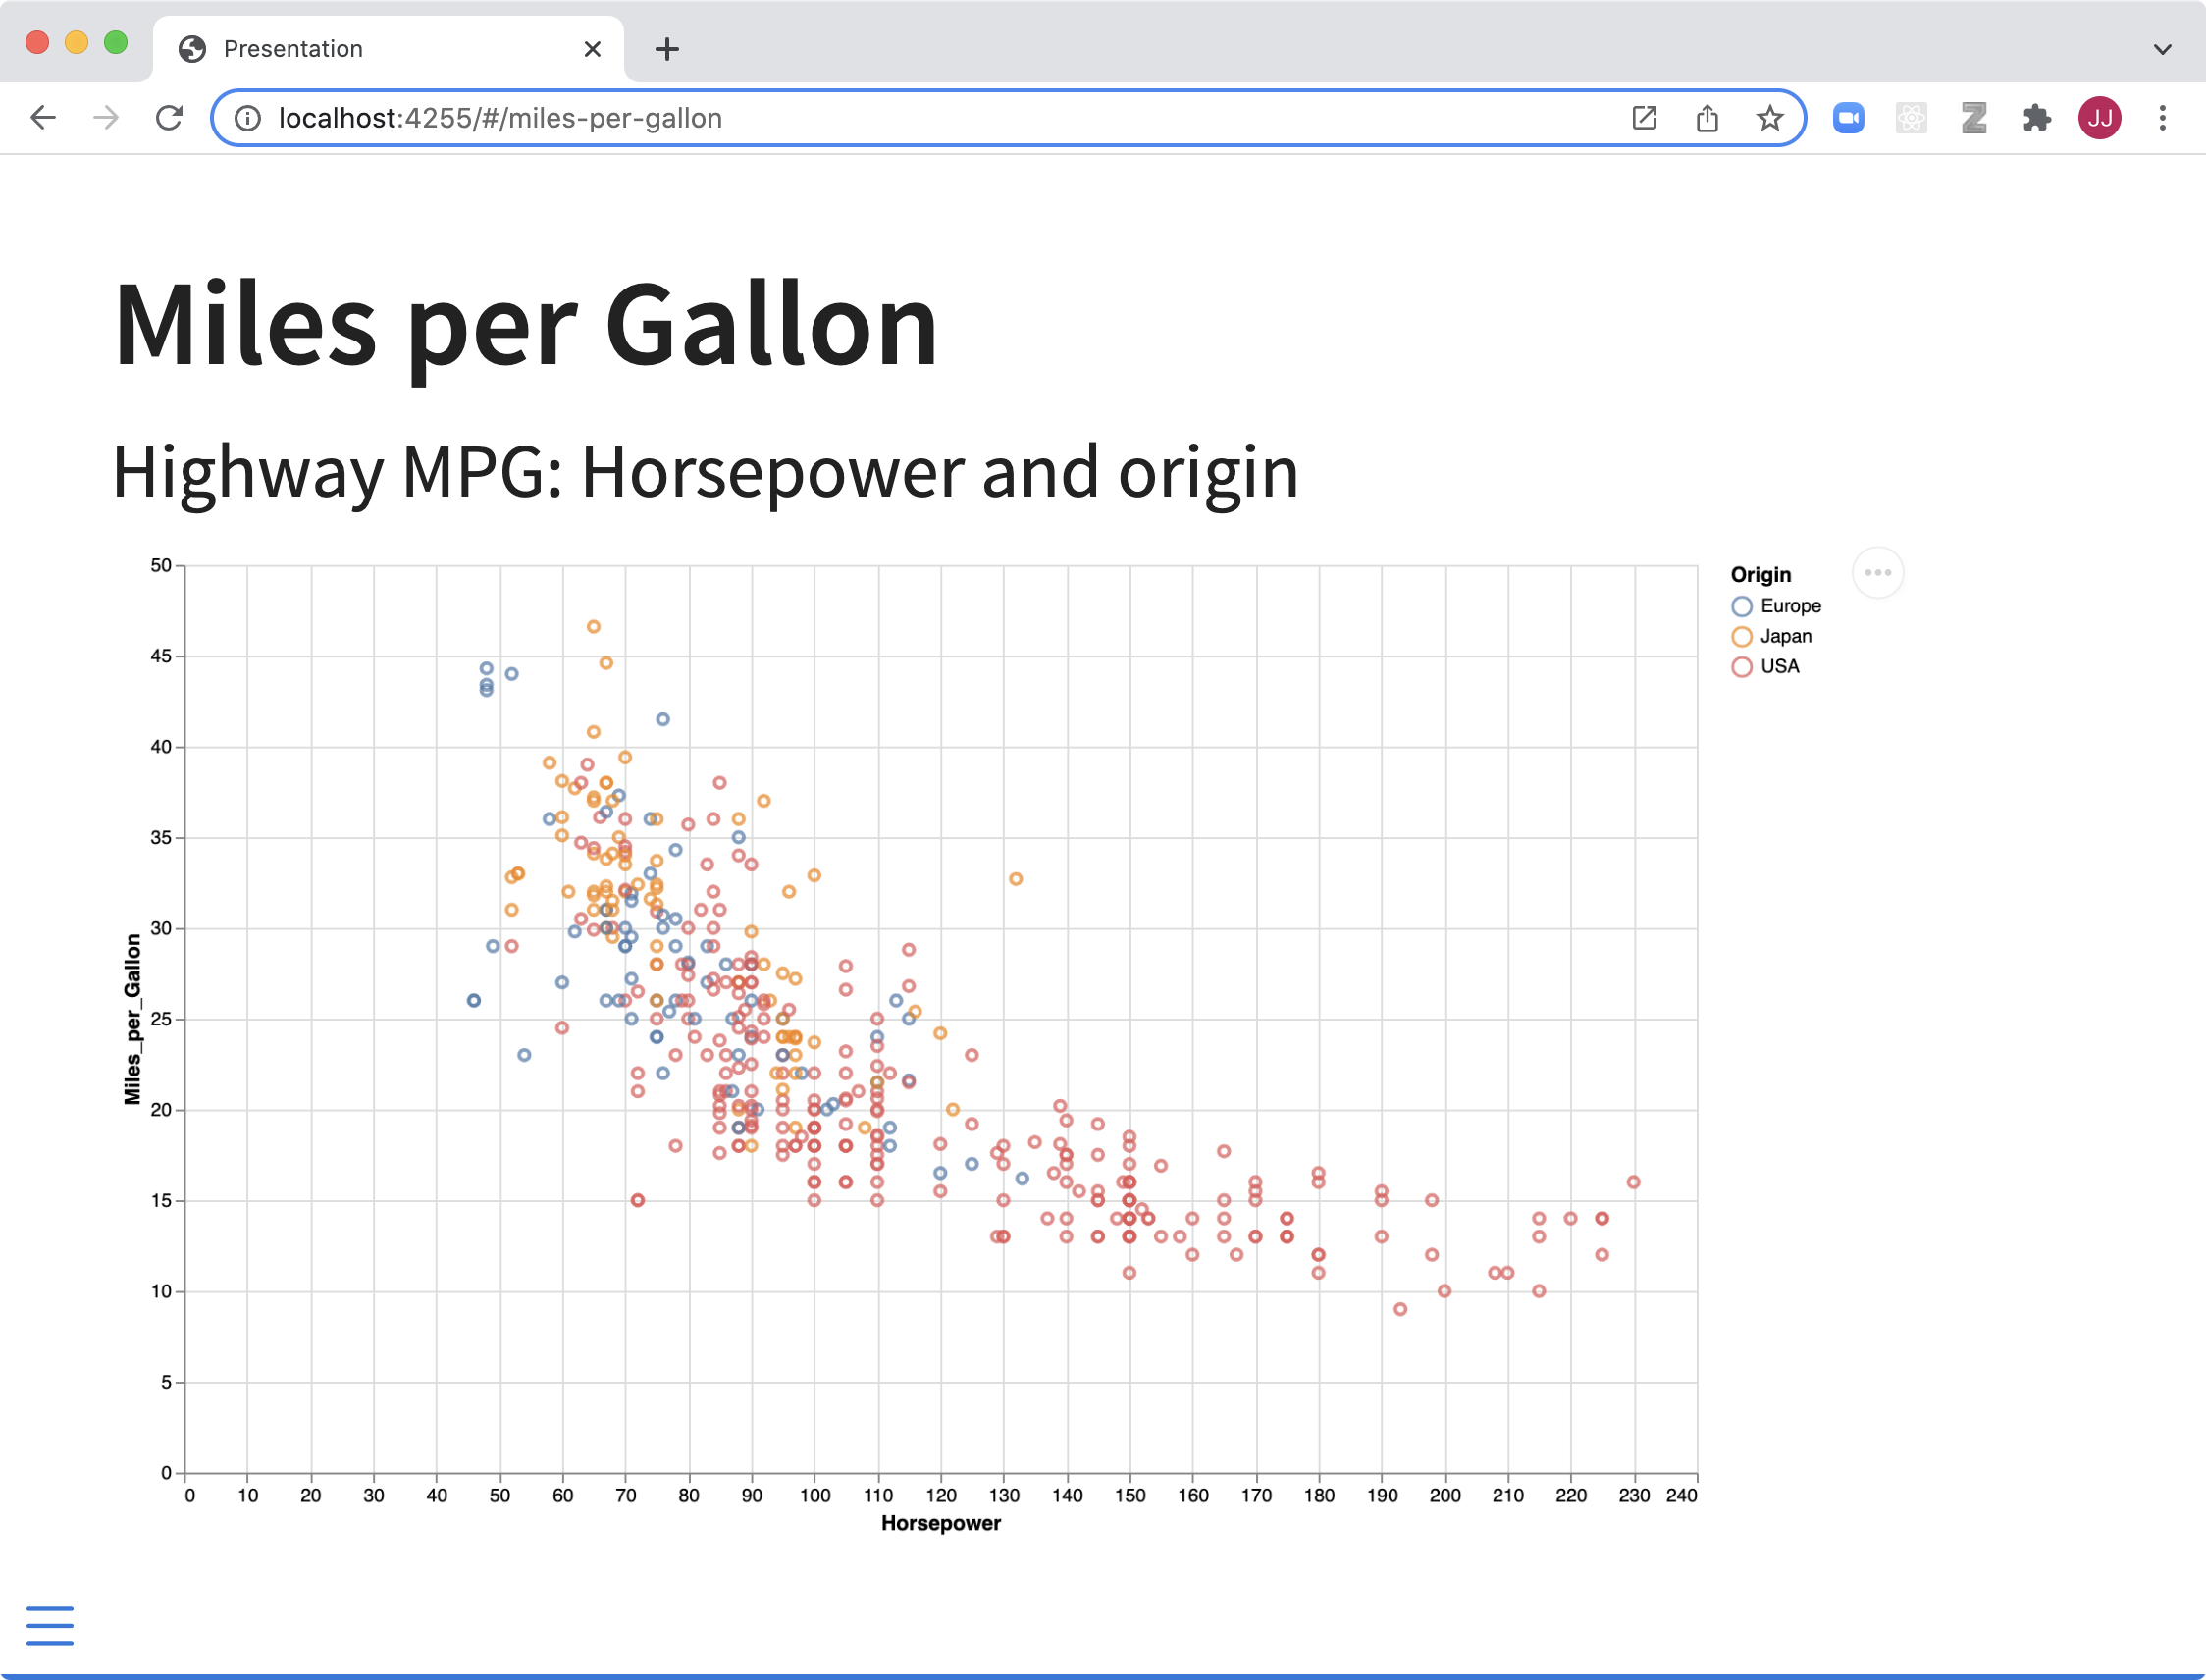
Live side-by-side preview for any notebook or text editor including Jupyter and VS Code


Learn more: Jupyter, VS Code, Text Editors
Authoring Tools
RStudio includes an integrated presentation preview pane

Learn more: RStudio
And More…
- Touch optimized (presentations look great on mobile, swipe to navigate slides)
- Footer & Logo (optionally specify custom footer per-slide)
- Auto-Slide (step through slides automatically, without any user input)
- Multiplex (allows your audience to follow the slides of the presentation you are controlling on their own phone, tablet or laptop).
Learn more: Quarto Presentations
